

How do sustainability ratings work, and are they reliable?
The first thing people look for when trying to analyse the market through a sustainability lens is a universal metric that captures how sustainable a company is. They want it to be a systematic, repeatable and comparable metric for companies in the market. Enter the sustainability rating.
What is an example of this?
The often quoted example is Tesla, the electric car manufacturer. Sustainability ratings for Tesla show a high amount of variation, with some rating the company as very sustainable and others as very unsustainable.
In short, the sustainability rating depends on how much weighting is given to the environmental aspect of the business (which is very good as a result of electric vehicles substituting for internal combustion engine cars and the resulting improvements in tail pipe emissions as well as local air quality); as compared to the more social aspects of the business such as staff treatment, the safety record for workers and governance (where, at times, historically this has been poor).
What about ‘temperature alignment’ scores?
We all want to know what type of companies are going to rise to the challenge and halve their absolute emissions each decade between now and 2050 so they can become competitive and thrive in the ultra-low carbon economy we all need.
In short, we want to know which companies are and which aren’t aligned to our internationally agreed target to keep the global average temperature rise (as compared to pre-industrial levels) below two degrees centigrade and ideally below one and a half degrees centigrade (the Paris Agreement). Enter the temperature alignment concept in which a company (and therefore you can do this for a fund) is assigned a temperature score of how much it is expected to raise global temperatures.
How is this figure worked out?
In short, because we know the decarbonisation path, it is primarily based on publicly-stated decarbonisation targets which are often encapsulated in one of the many science-based target initiatives that help companies work out how to decarbonise and at what rate.
The logic being that if we need to halve absolute emissions by 2030, let’s measure what the company plans are to decarbonise and compare this to this rate: companies doing nothing get a high temperature alignment score (which is bad) and those companies with more aggressive decarbonisation targets than this halving of emissions each decade get a low temperature alignment score (this is good).
You end up with one number for your fund where a temperature alignment score of 1.5 degrees or less is very good and anything above 2 degrees is bad as it is not aligned with the Paris Agreement. This is clearly important, a useful measure and a way of holding companies to account and challenging them to decarbonise in line with the science.
Surely this encapsulates everything we really need to know about carbon, so what’s the problem?
By way of illustration, let us compare a big oil company (we don’t invest in these companies) with a childcare provider (we do invest in these companies) looking at emissions, decarbonisation targets and temperature alignment scores.
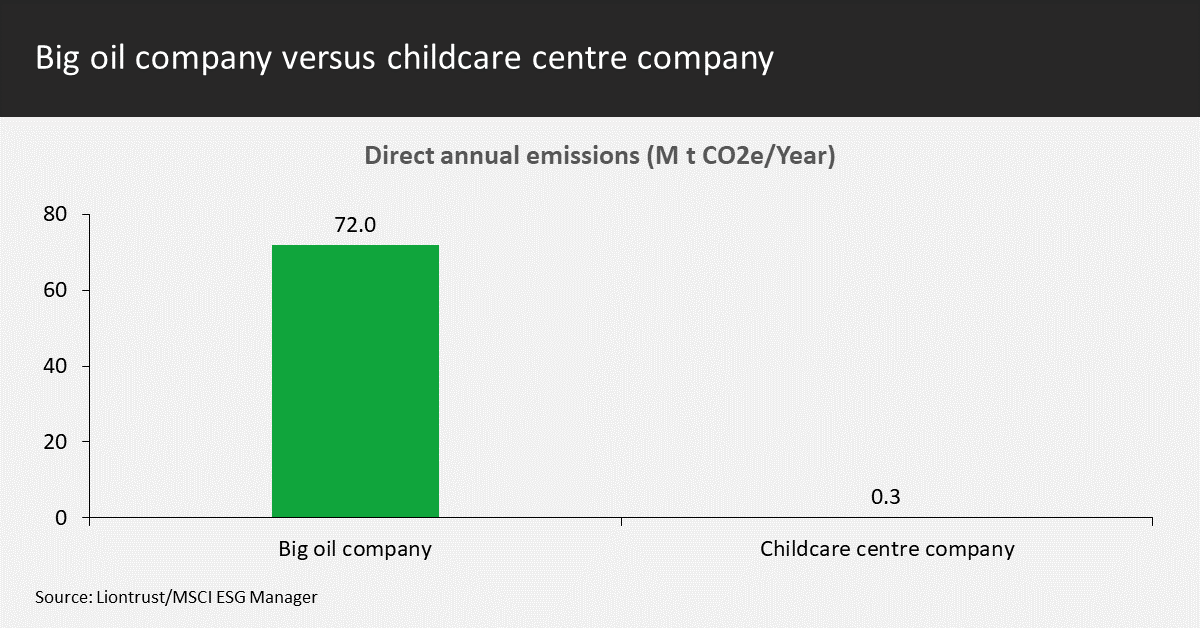
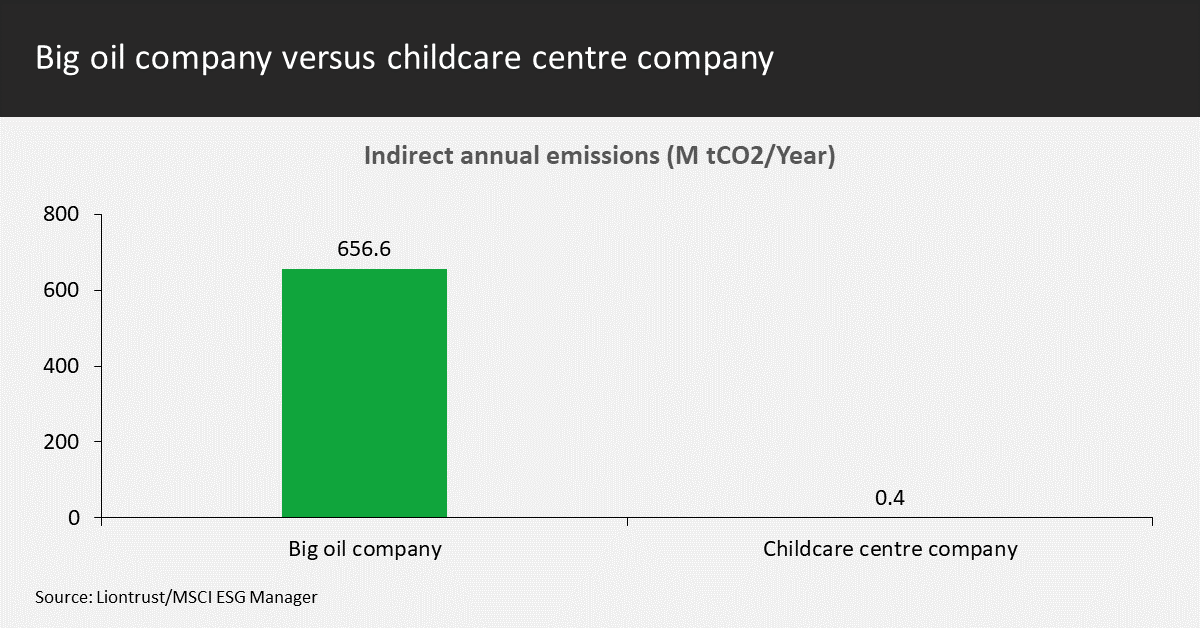
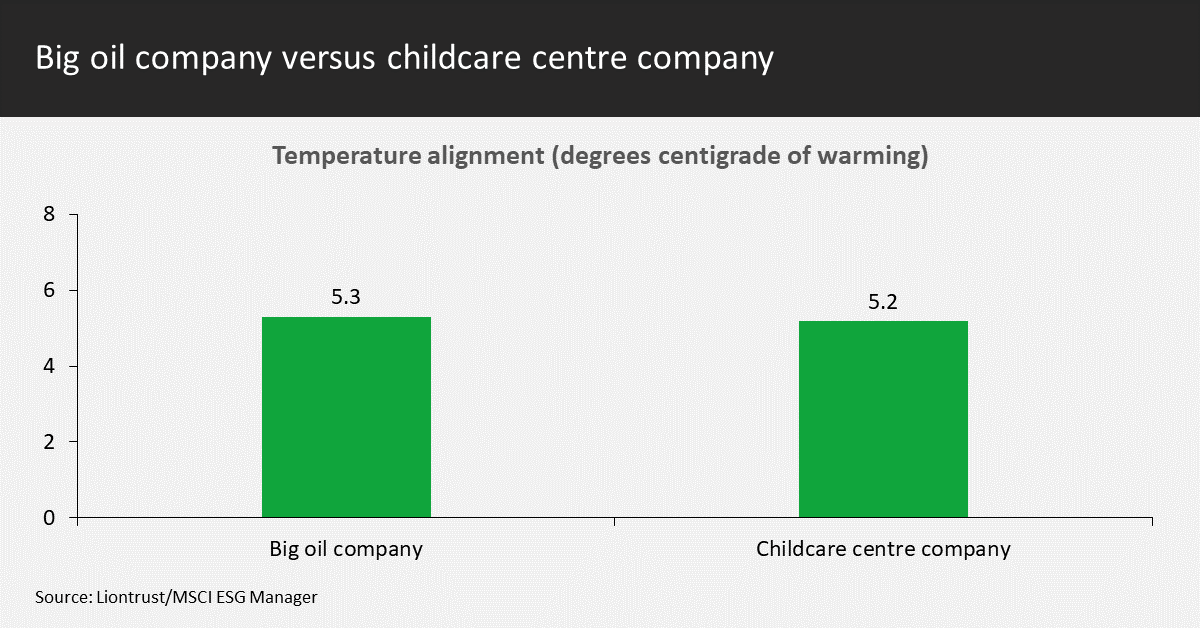
Source: Liontrust/MSCI ESG Manager
What do these tables show?
- The big oil company emits orders of magnitude of more direct and indirect emissions compared to the childcare company. Direct emissions are 225 times higher for the big oil company and indirect emissions1 are more than 1,000 times higher, amounting to a whopping 657 million tonnes of CO2e per year. To put this in perspective, this is 55 per cent MORE than total UK emissions (excluding imports and airlines), estimated to be 424 million tonnes in 20212.
- The big oil company is much larger than the childcare company, but even correcting for this size difference and using a carbon intensity of sales number, the big oil company emits 8.5x more direct emissions for every unit of sales.
- And yet they have very similar temperature alignment metrics of 5.3 degrees warming for the big oil company and 5.2 degrees warming potential for the childcare company. This assumes the companies meet any decarbonisation commitments they have made.
- Incidentally, both these companies achieve the second highest ESG rating from the external ESG data provider. Our analysis draws very different scores for how sustainable these two businesses are.
Why do they have such similar temperature alignment metrics?
Put simply, this is because this metric is very focused on the decarbonisation targets and assumes these will be achieved. The big oil company has a target to decarbonise, the childcare company does not.
I’ll leave you to decide which company is likely to halve their emissions by 2030 while maintaining their presence in their core business (clue: not necessarily the one with publicly stated decarbonisation targets).
What other elements does this metric miss?
- How much does the company emit now, and therefore how likely is it that the company will meet this Paris Aligned rate of decarbonisation?
- Are there other lower carbon alternatives to this businesses’ products and services (what is the risk of major disruption)?
- How credible is their strategy to decarbonise?
All of this is very important when thinking about how a company will perform (and it’s future cashflows) as we transition to an ultra-low carbon economy. But none of it is encapsulated in the current temperature alignment models that spit out one number.
Temperature alignments may tend to be overestimated (be worse than common sense would suggest) for funds with a higher proportion of smaller companies or companies in geographies where signing up to decarbonisation initiatives is less common (i.e. outside of Europe).
What is Liontrust doing about this?
We are meeting with companies we are invested in to challenge them to decarbonise their business in line with the science and discuss their strategy for trying to achieve this. This is resource intensive but invaluable in understanding how the businesses are set to meet this challenge.
This does not comprise simply emailing companies and asking them to sign up to a net zero initiative (although joining these initiatives is not discouraged); it is a more meaningful interaction as we are trying to understand where in the businesses the emissions are coming from and what the businesses can do to reduce them while still remaining profitable.
Not all companies will be able to achieve this. We summarised our findings so far in this article here.
What’s the answer?
We should continue to use sustainability ratings and temperature alignment metrics, but we should be aware of their limitations and how to interpret them. People should not take these purely at face value if they don’t understand their limitations. Where there are discrepancies, these should be accepted and explained simply. For a more meaningful picture we must also include other metrics such as:
- Exposure to positive trends from the core business of companies, as well as;
- Carbon foot printing that captures what businesses emit today, and also;
- The quality of engagement and how demanding investment teams are being of companies (are they being progressive in agitating for the quicker pace of change we all need or are they reactive and essentially happy with business-nearly-as-usual).
In conclusion, sustainability metrics are useful but you need to understand what they measure and be able to explain inevitable discrepancies. Cross referencing more than one metric helps get a more meaningful picture of how sustainable a company or fund is, which is multi-dimensional.
[1] Estimating indirect (scope 3) emissions is still in it’s infancy, but the quantum is what we are trying to highlight in this example.
[2] UK Government, BEIS 31-Mar-2022, https://assets.publishing.service.gov.uk/government/uploads/system/uploads/attachment_data/file/1064923/2021-provisional-emissions-statistics-report.pdf – accessed 25-Oct-2022